Marketing is no longer a gut feeling. It's data. But the right data. You can easily get bogged down with likes, views and clicks with no real meaning. The trick is to choose KPIs that help you reach your goal — more leads, more customers, more impact. In this article, you get clear KPI examples for marketing, organized according to the customer journey and supplemented with tips for visualization in dashboards.
What exactly do marketing KPIs measure?
Marketing KPIs map how well your efforts score in terms of visibility, engagement, conversion and return. They answer questions such as:
- Are we reaching the right target group?
- Do our campaigns deliver quality leads?
- What is the ROI of our marketing budget?
- Which channels work, which ones don't?
Important: Marketing KPIs must be actionable. They not only show what is happening, but also give direction to optimizations.
KPIs at the top of the funnel (reach & awareness)
This phase is about being visible to the right target group. You want to measure how many people you reach, how often and via which channel.
1. Website visitors
What? Number of unique visitors per day/week/month
Use: Analyze origin (organic, paid, referral...) to optimize channels.
2. Impressions and screenings
What? How often your ad or content is shown
Please note: Not a quality measure, but good for detecting trends.
3. Social media reach
What? Number of unique users who saw your post
Use: Measure viral potential and channel effectiveness (e.g., LinkedIn vs. Instagram)
4. E-mail open rate
What? Percentage of recipients who open your mail
Action: Test subject lines and shipping times.
Engagement and conversion KPIs
Engagement tells you whether your message sticks. Conversion measures whether it encourages action.
5. Click-through rate (CTR)
What? What percent of viewers actually click
Application: In email, social media and Google Ads.
Formula: clicks ÷ impressions × 100
6. Time on page
What? How long do visitors stay on a specific page?
Use: Measure content quality or relevance of landing pages.
7. Lead generation (form fills, downloads...)
What? How many people leave their details in exchange for content or a demo?
Use: Measure per channel or campaign for optimization.
8. Engagement rate (social)
What? How much interaction (likes, comments, shares) per 1,000 views
Action: Measure which content really resonates with your target group.
ROI of campaigns and channels
What do your marketing efforts actually deliver in euros? These KPIs measure the financial impact.
9. Cost per lead (CPL)
What? On average, what does it cost to generate a lead
Formula: marketing cost ÷ number of leads
Action: Benchmark per channel and adjustments
10. Customer Acquisition Cost (CAC)
What? Total marketing and sales cost to win 1 customer
Please note: Combine this with Customer Lifetime Value (CLV) to measure profitability
11. Marketing ROI
What? Total campaign revenue vs. total cost
Formula: (Revenue — Costs) ÷ Costs × 100
Use: Measure marketing's real contribution to growth
12. Lead-to-Customer conversion
What? How many leads actually become customers
Use: Crucial for B2B funnels with longer sales cycles
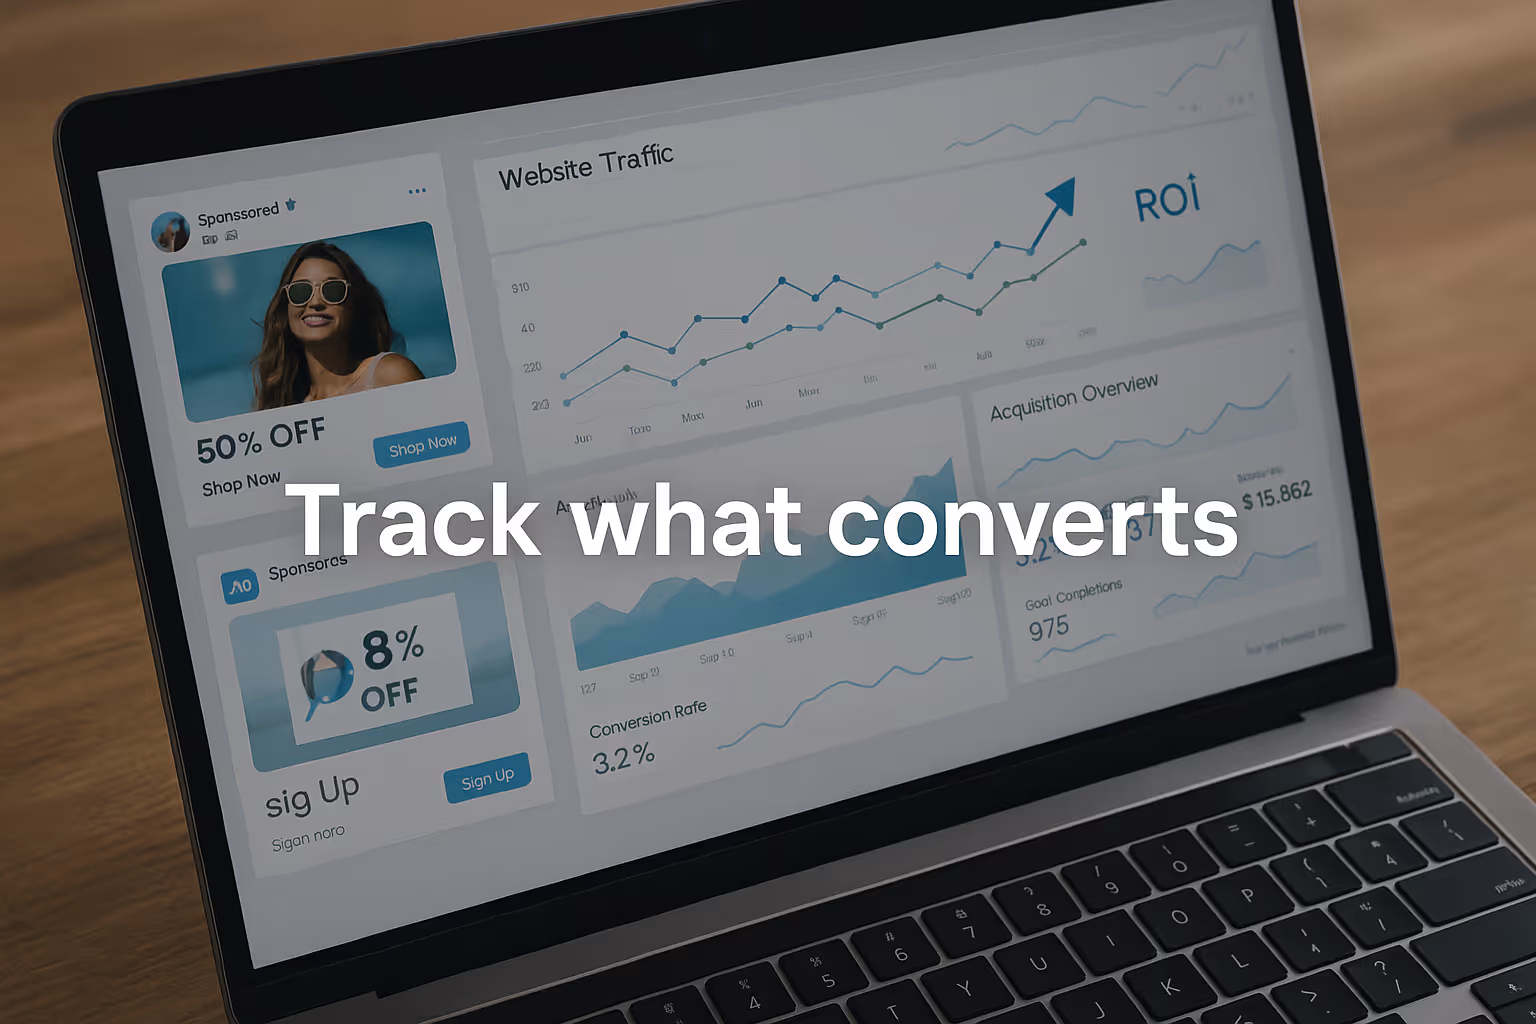
Marketing dashboards in practice
With KPIs alone, you're not there yet. You should also make them visual. A good dashboard helps you quickly spot anomalies, recognize patterns and communicate impact to colleagues or management.
What a good marketing dashboard includes:
- KPIs per channel (SEO, SEA, email, social)
- Filters by period, target group or campaign
- Goals in addition to achievements
- Trends charts (line, bar, funnel)
Examples of dashboards:
• Social dashboard with engagement by post type
• Email dashboard with open/click/conversion rates
• Lead generation dashboard with source, cost and quality per campaign
Common mistakes in marketing KPIs
- Measure everything → you lose focus
- Too much on vanity metrics (likes, views) → little impact
- No connection to sales or business goal
- KPIs without action or follow-up
Choose KPIs based on objective (not tool)
- Work with targets per KPI
- Combine quantitative data with qualitative feedback
Summary: Which KPIs matter most?
That depends on your type of company, target group and marketing goals. However, there are a few universal KPIs that are almost always valuable:
- Website traffic by channel
- Click-through rates
- Lead quality and conversion
- Marketing ROI
Ready to use marketing KPIs?
Read more:
In the construction sector, marketing KPIs help monitor lead quality and project requests.
Manufacturing companies use marketing KPIs to identify market demand and product interest.
Logistics service providers can measure their visibility and customer retention with marketing KPIs.
Internal employer branding campaigns require HR KPIs such as engagement and flow.