
Helps monitor important parameters and allows you to respond quickly to anomalies. This contributes to optimizing the supply chain, reducing costs and improving customer satisfaction. Quickly and easily manage purchasing costs, your stocks, monitor supplier performance and ensure an efficient purchasing strategy.
Thanks to automation and clear dashboards, we can now focus on analyzing results instead of wasting time collecting data.

Thanks to our new data visualization and data analysis application, we save a lot of time in the sales and marketing department. We also optimized our prices and margins, increasing our turnover.

We have insight into our sales, margins and customer turnover at a glance. This way, we can not only keep our prices competitive, but also respond more specifically and proactively to the needs of our customers.

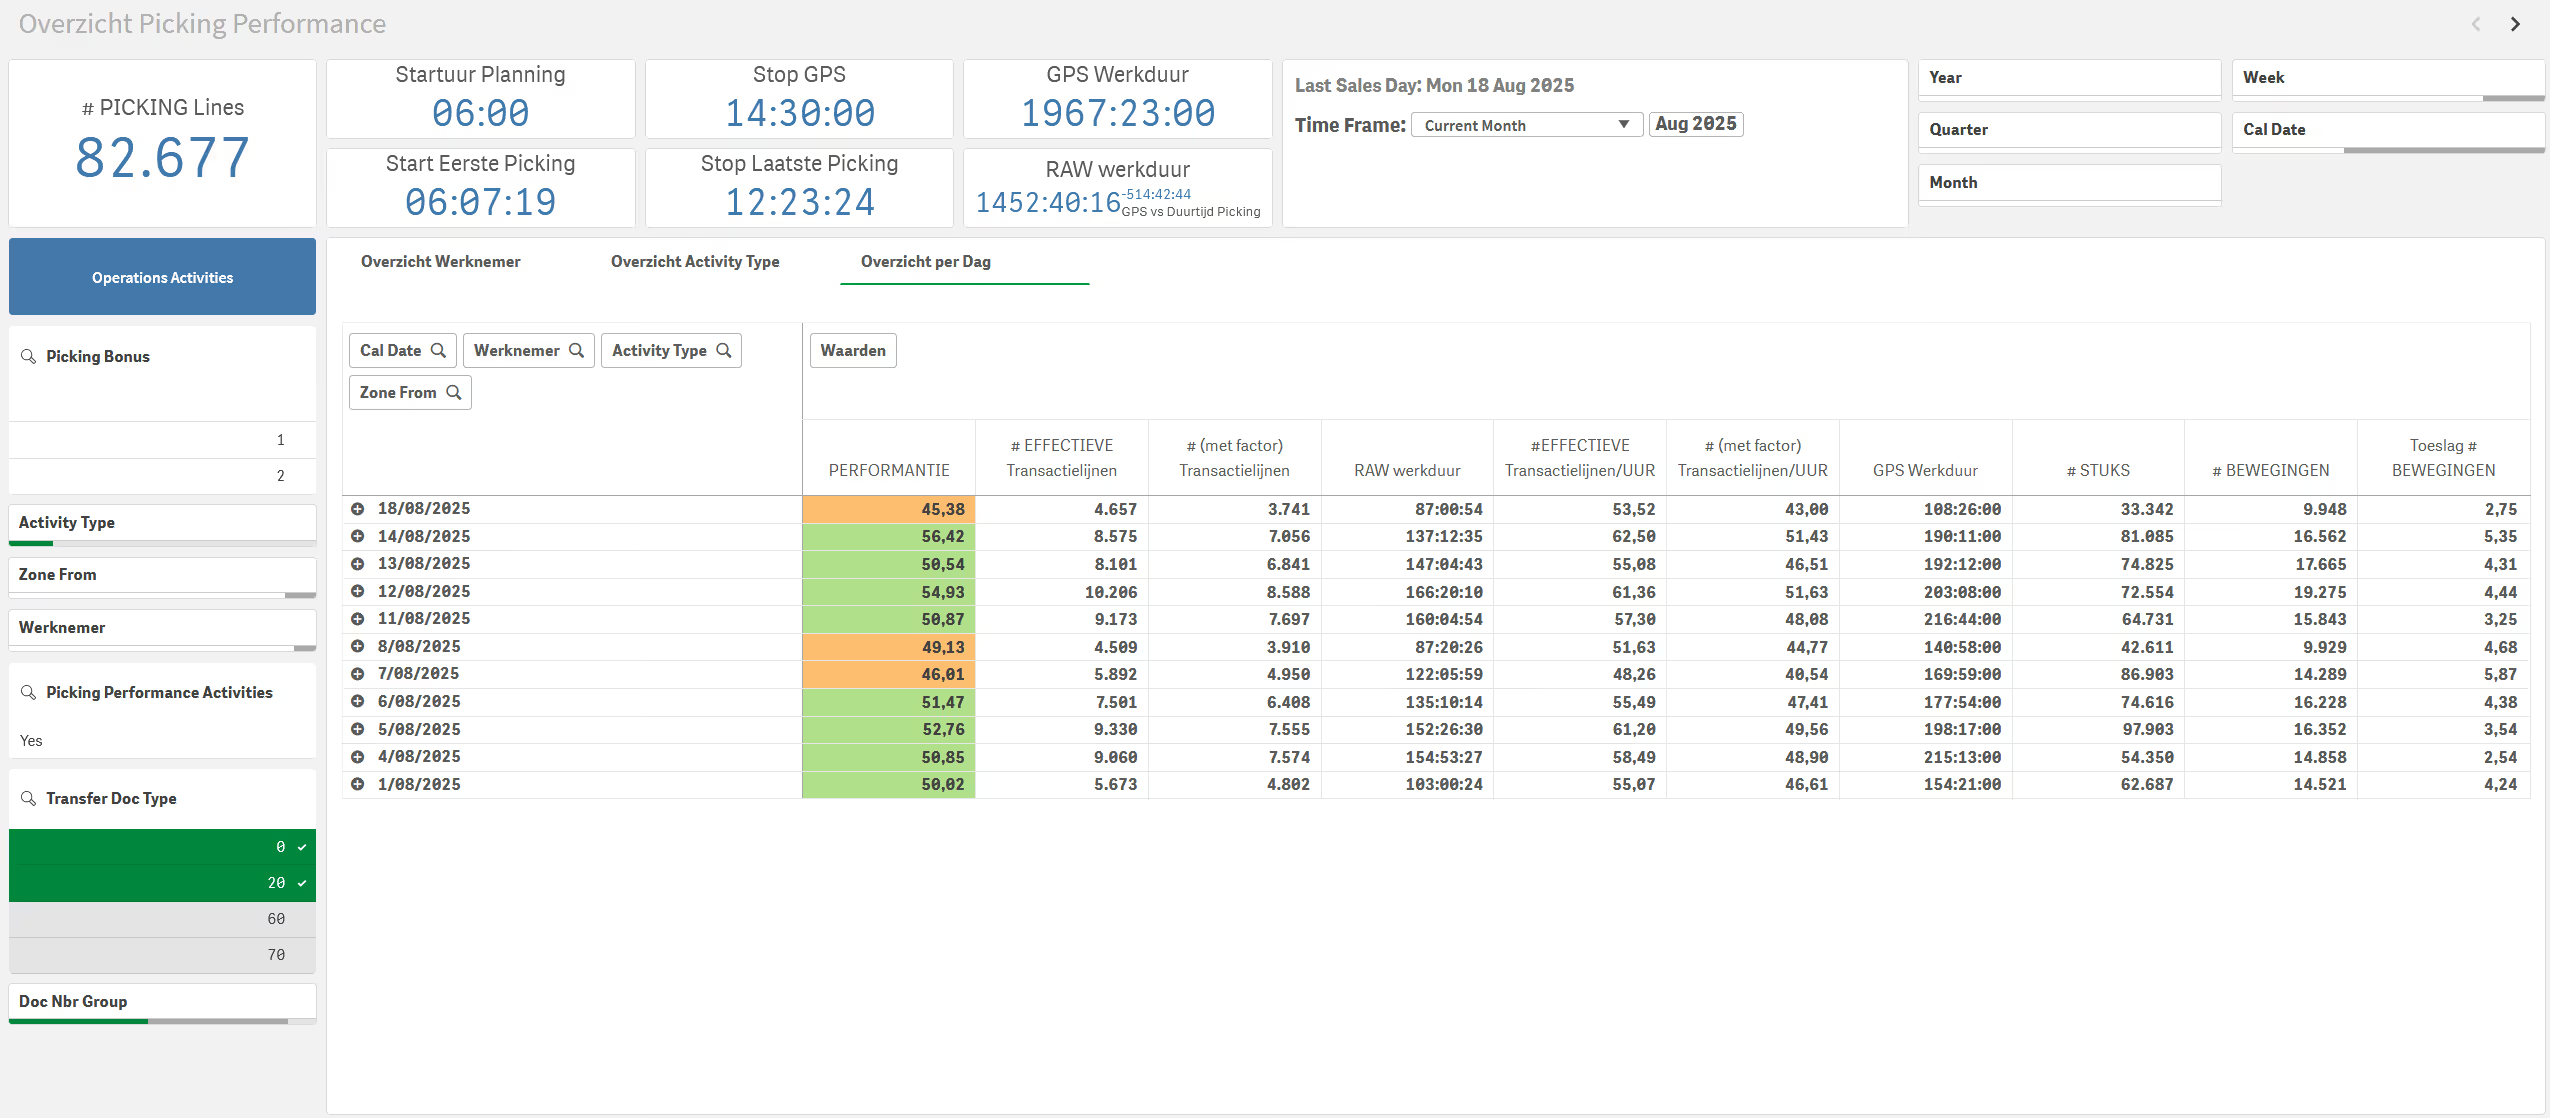
The Supply Chain App provides insight into inventory, purchasing, suppliers, orders, logistics flows and availability. The App helps companies better manage inventory value, stock rotation, delivery reliability, purchasing performance and working capital. This makes the supply chain less reactive and more predictable.
The Supply Chain App is suitable for companies with inventory, purchasing processes, suppliers, warehouses, distribution or complex goods flows. Think of wholesalers, production companies, logistics companies, e-commerce companies, distributors and organizations with multiple branches or warehouses.
You get insight into inventory levels, inventory value, stock rotation, open orders, delivery reliability, purchase prices, supplier performance, backorders, incoming goods, outgoing goods and product availability. Depending on the data, you can analyze by product, product group, supplier, warehouse, branch, customer segment or period.
Yes. The App helps show which products have too much inventory, which products rotate too slowly and where stockouts or backorders occur. This allows you to better manage availability and working capital. Too much inventory ties up capital. Too little inventory can lead to missed sales or lower customer satisfaction.
Yes. Supplier performance can be made visible based on delivery reliability, lead time, price deviations, open orders, quality or other available indicators. This makes it clear which suppliers deliver reliably and where structural problems arise.
Yes. The Supply Chain App can analyze purchasing data by supplier, product group, period, warehouse or branch. You gain insight into purchase volume, purchase prices, price development, delivery performance and deviations. This helps purchasing teams negotiate better and respond faster to price or delivery problems.
Examples include inventory value, stock rotation, days inventory outstanding, backorders, service level, delivery reliability, open purchase orders, average lead time, purchase price development, inventory by warehouse and slow-moving stock. KPIs such as forecast accuracy, safety stock and obsolete stock may also be relevant, depending on the data.
Yes. Products that sell slowly or remain in stock for a long time can be made visible. This helps reduce inventory, improve purchasing decisions and free up space or capital. Slow movers are often a hidden cost, especially for companies with a broad product range.
Typical data sources include ERP, WMS, purchasing software, inventory management, supplier data, sales data, warehouse systems and Excel files. Supply chain insights often become stronger when purchasing, inventory and sales data are analyzed together.
You can make better decisions about which products need to be reordered, which inventory is too high, which suppliers need extra follow-up and where working capital is tied up. The App helps better align purchasing, inventory management and logistics.