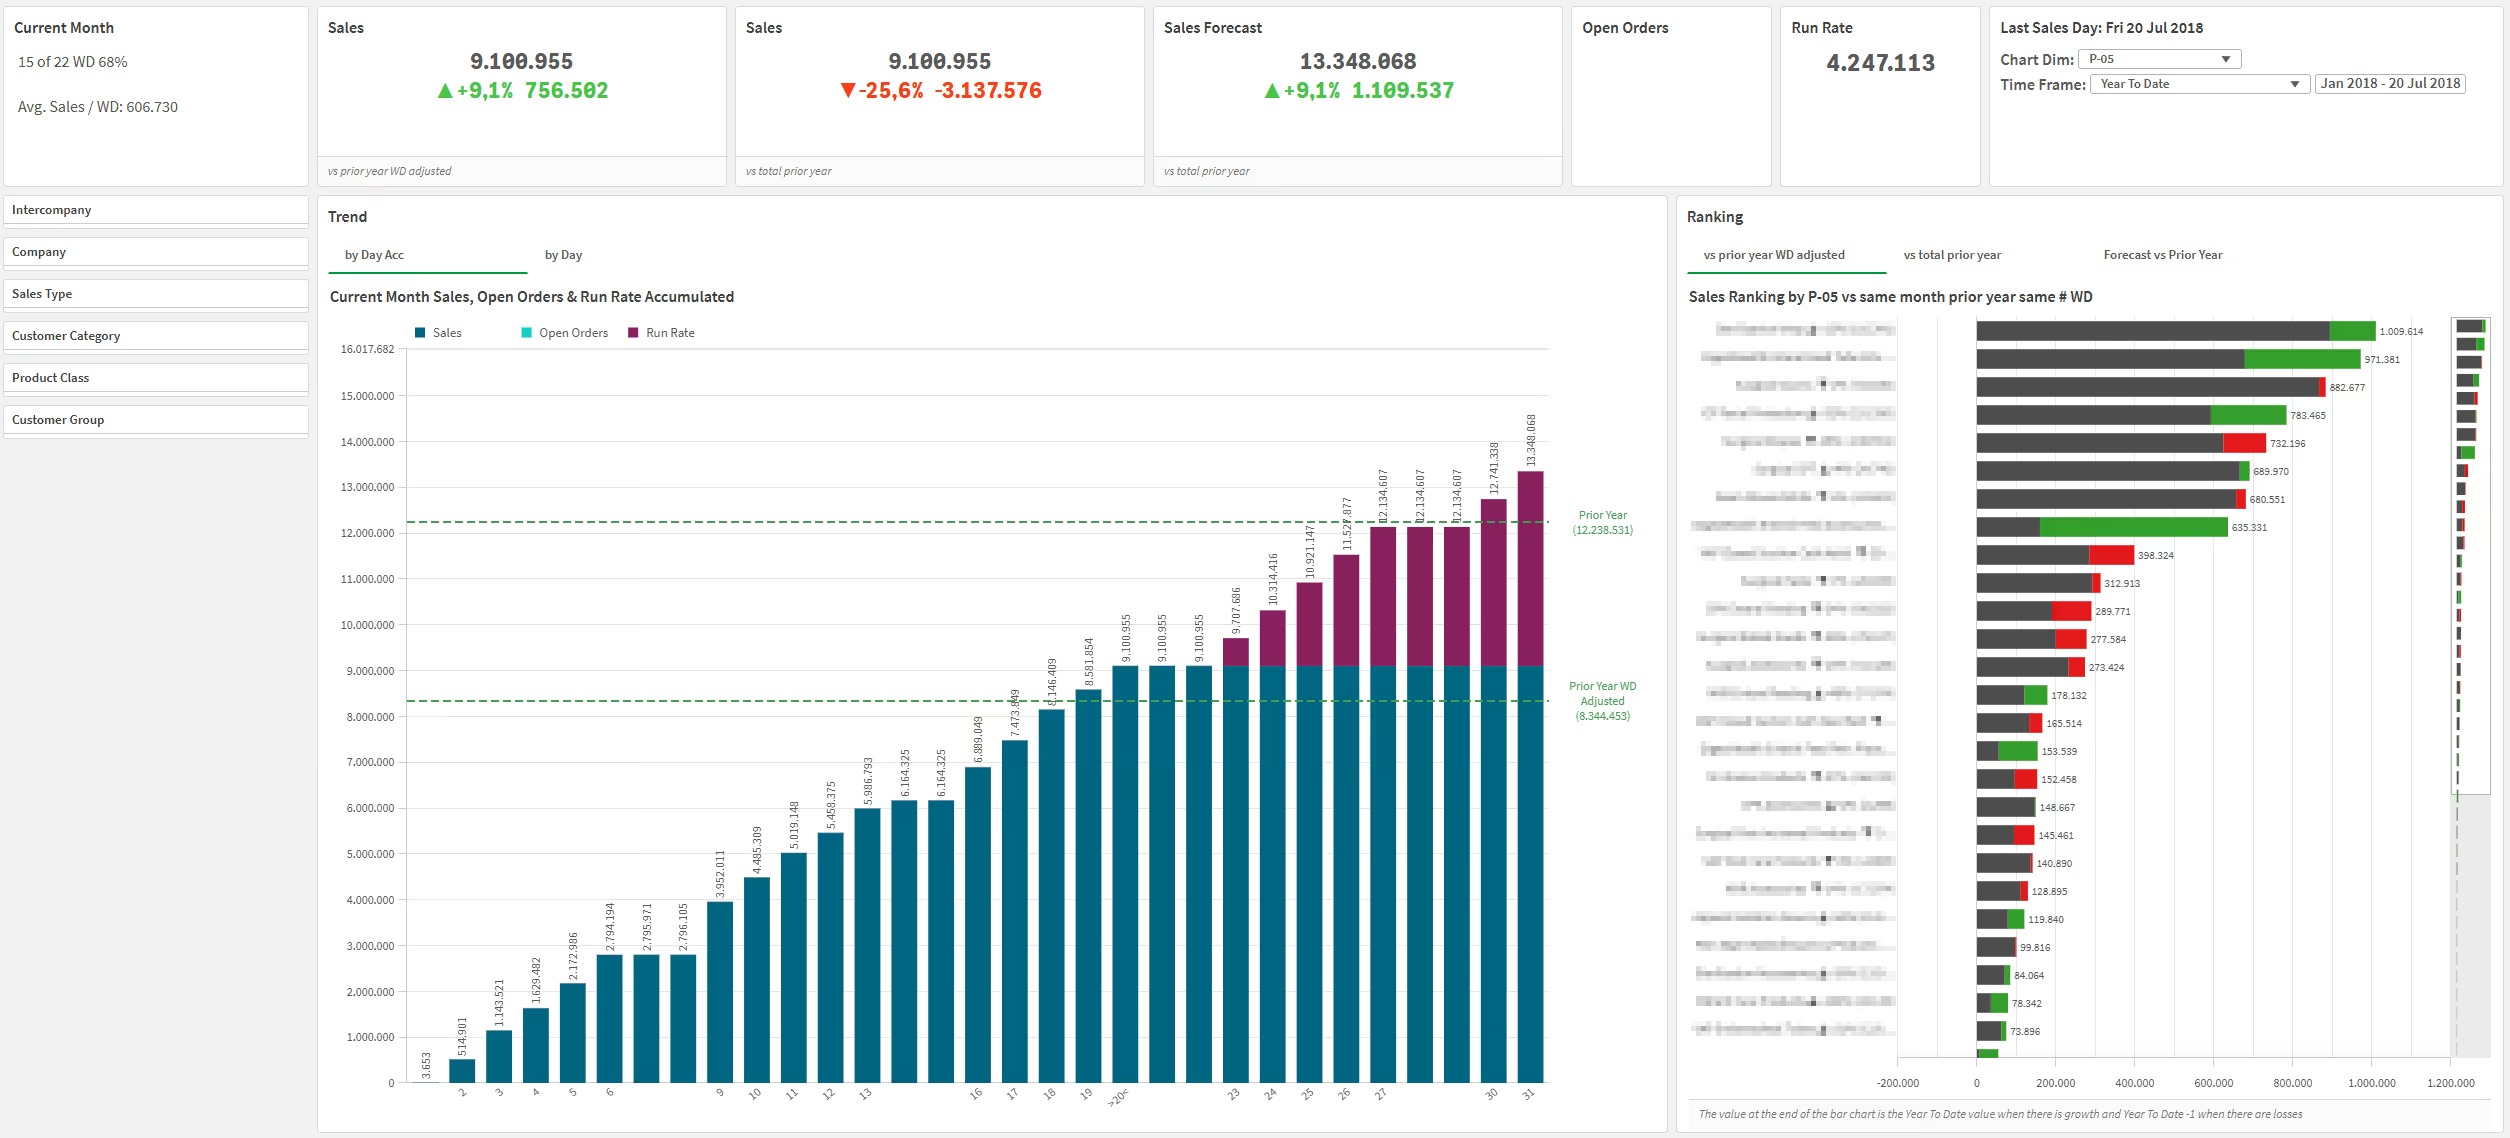
Your company gets the tools to quickly answer strategic and operational questions about sales and margins. Get insights into sales teams, channels, customers, and product categories. Easily compare periods or measure performance against forecasts or budgets.
With the Sales Intelligence App, you can get the most out of your sales data. Discover trends, identify your most profitable products and customers, and optimize margins. With real-time insight into your sales performance, you can quickly respond to changes in the market and take targeted actions to increase sales and margins.
We have achieved a fundamental transformation in our data-driven decision making. It provides us with real-time insights that not only increase efficiency, but also give our growth strategy a huge boost.

We have insight into our sales, margins and customer turnover at a glance. This way, we can not only keep our prices competitive, but also respond more specifically and proactively to the needs of our customers.

The Sales Intelligence App provides insight into actual sales, revenue, margin, customers, products, salespeople, regions, and commercial performance. The App helps sales and management to better understand where growth is, where margin is lost, and which customers, products, or segments generate the most value. The focus is not only on increasing sales but primarily on achieving more profitable sales.
The Sales Intelligence App is suitable for companies with many customers, products, orders, sales representatives, regions, or sales channels. The App is particularly relevant for wholesalers, distributors, manufacturing companies, B2B businesses, e-commerce companies, and organizations where commercial performance is not easily or fully visible in standard ERP or CRM reports.
You gain insight into revenue, margin, gross profit, customer behavior, product performance, sales per region, salesperson performance, product mix, customer segments, churn signals, and commercial developments. Depending on the available data, you can analyze by customer, product, product group, salesperson, region, channel, segment, location, or period.
Yes. A high-revenue customer isn't automatically profitable. By analyzing revenue, margin, discounts, product mix, and potentially operational costs collectively, you gain a better understanding of which customers truly contribute to profitability. This helps to sharpen commercial priorities and better justify customer agreements.
Yes. The App can help identify margin loss per customer, product, product group, salesperson, region, or channel. This allows you to quickly see where margins are declining due to price pressure, discounts, a changed product mix, incorrect pricing agreements, or the sale of lower-profitability products.
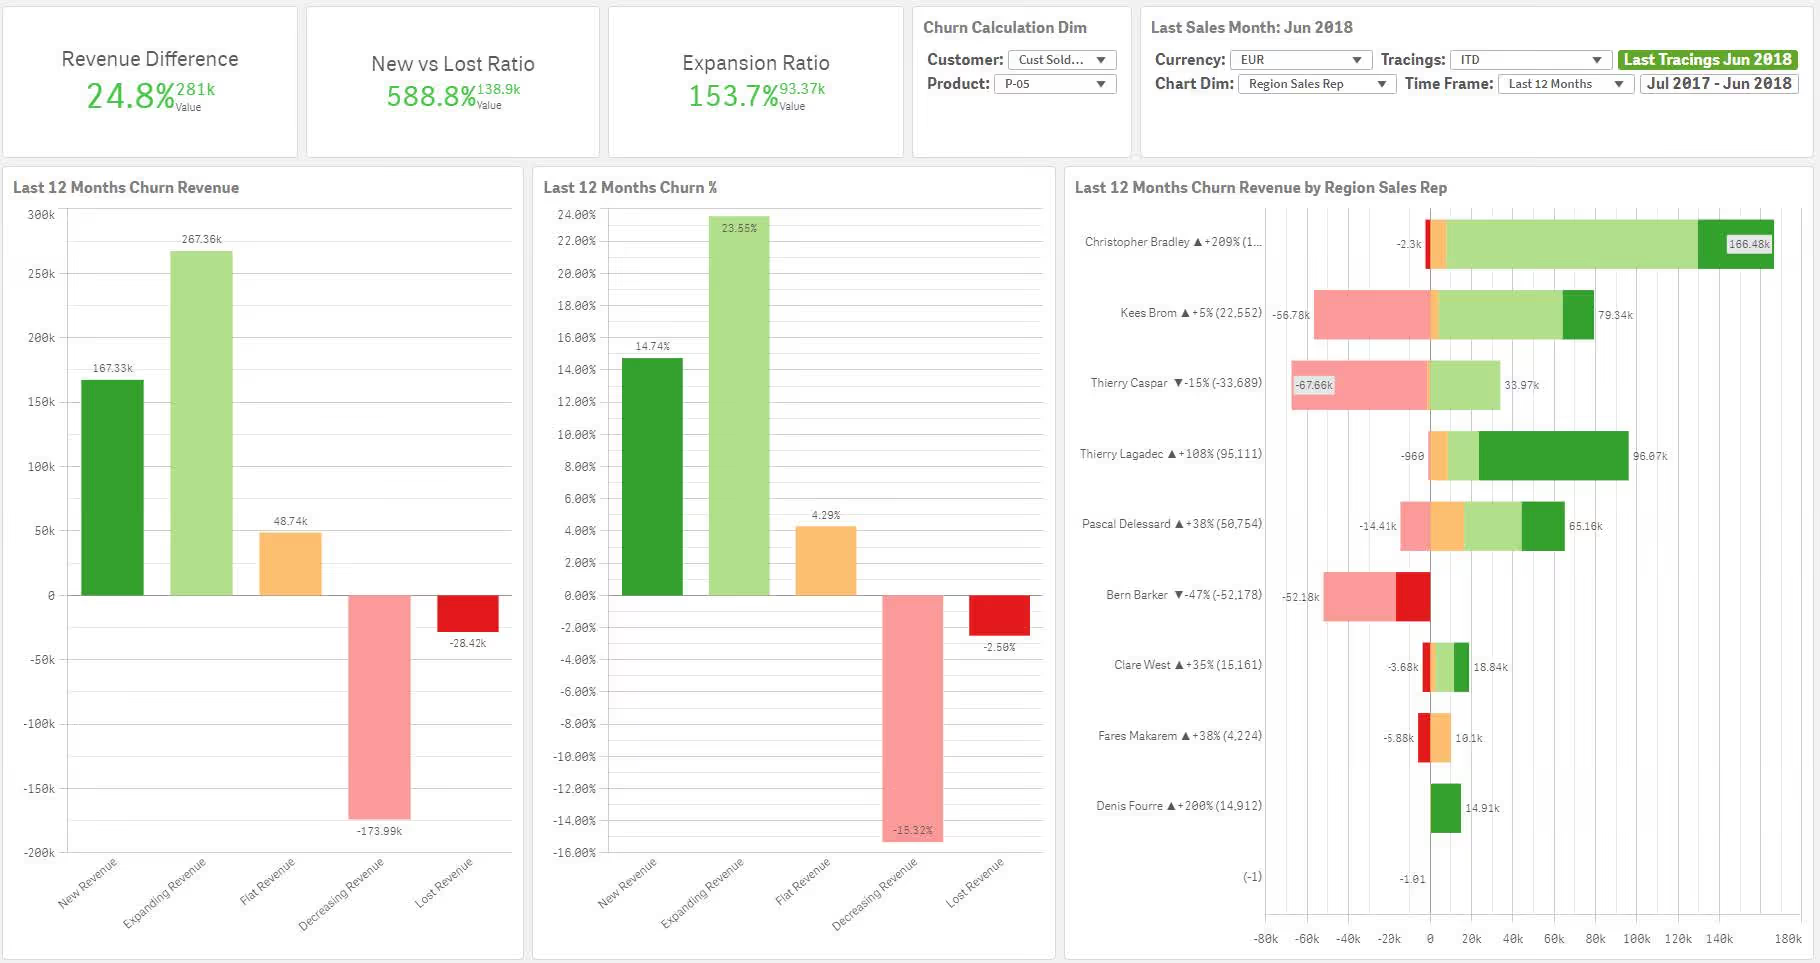
Yes. Historical purchasing behavior can reveal signals indicating customer churn or declining activity. For example, customers who order less frequently, purchase lower volumes, stop buying certain product groups, or suddenly deviate from their usual buying patterns. This empowers sales to act more quickly.
Yes. The App can show which products sell well, which products generate profit, which product groups are growing, and which products contribute less than expected. This helps with assortment management, pricing, promotions, inventory decisions, and commercial focus. It can also easily perform a PMC analysis .
Yes. Sales performance can be analyzed by salesperson, team, region, customer segment, channel, or product group, depending on the available data. Furthermore, you can look not only at revenue but also at margin, customer growth, customer retention, product mix, and performance against last year or target.
Sales Intelligence primarily focuses on realized sales. The App displays revenue, margin, customers, products, and sales performance based on actual sales data. Sales Pipeline looks ahead at opportunities, quotes, forecasts, and commercial follow-up. Together, both Apps provide a more complete picture. Sales Pipeline reveals potential future sales. Sales Intelligence shows what has actually been realized and whether it was profitable.
Examples include revenue, gross margin, margin percentage, revenue growth, customer revenue, customer margin, sales per product group, average order value, number of orders, churn signals, sales per salesperson, sales per region, and revenue versus last year. Other relevant KPIs may include cross-sell, upsell, product mix, top customers, declining customers, and margin impact per customer.
Indeed. That's often one of the biggest advantages. By combining sales data with finance, you gain a clearer understanding of which customers and products contribute financially. By combining sales data with operations, you can identify which commercial activities cause operational complexity. This way, you gain insight not only into revenue but also into the actual impact of sales on margin, capacity, inventory, and execution.
Typical data sources include ERP, CRM, invoicing data, order data, product data, customer data, price lists, discount information, e-commerce platforms, and Excel files containing targets or commercial segmentation. The exact data sources depend on where sales data is currently recorded and what commercial questions you want to answer.
You can make better decisions about which customers deserve extra attention, which products require a commercial focus, where pricing or discounts should be re-evaluated, and which regions, salespeople, or segments are performing well. The App helps sales and management to drive not just revenue, but primarily profitable growth.