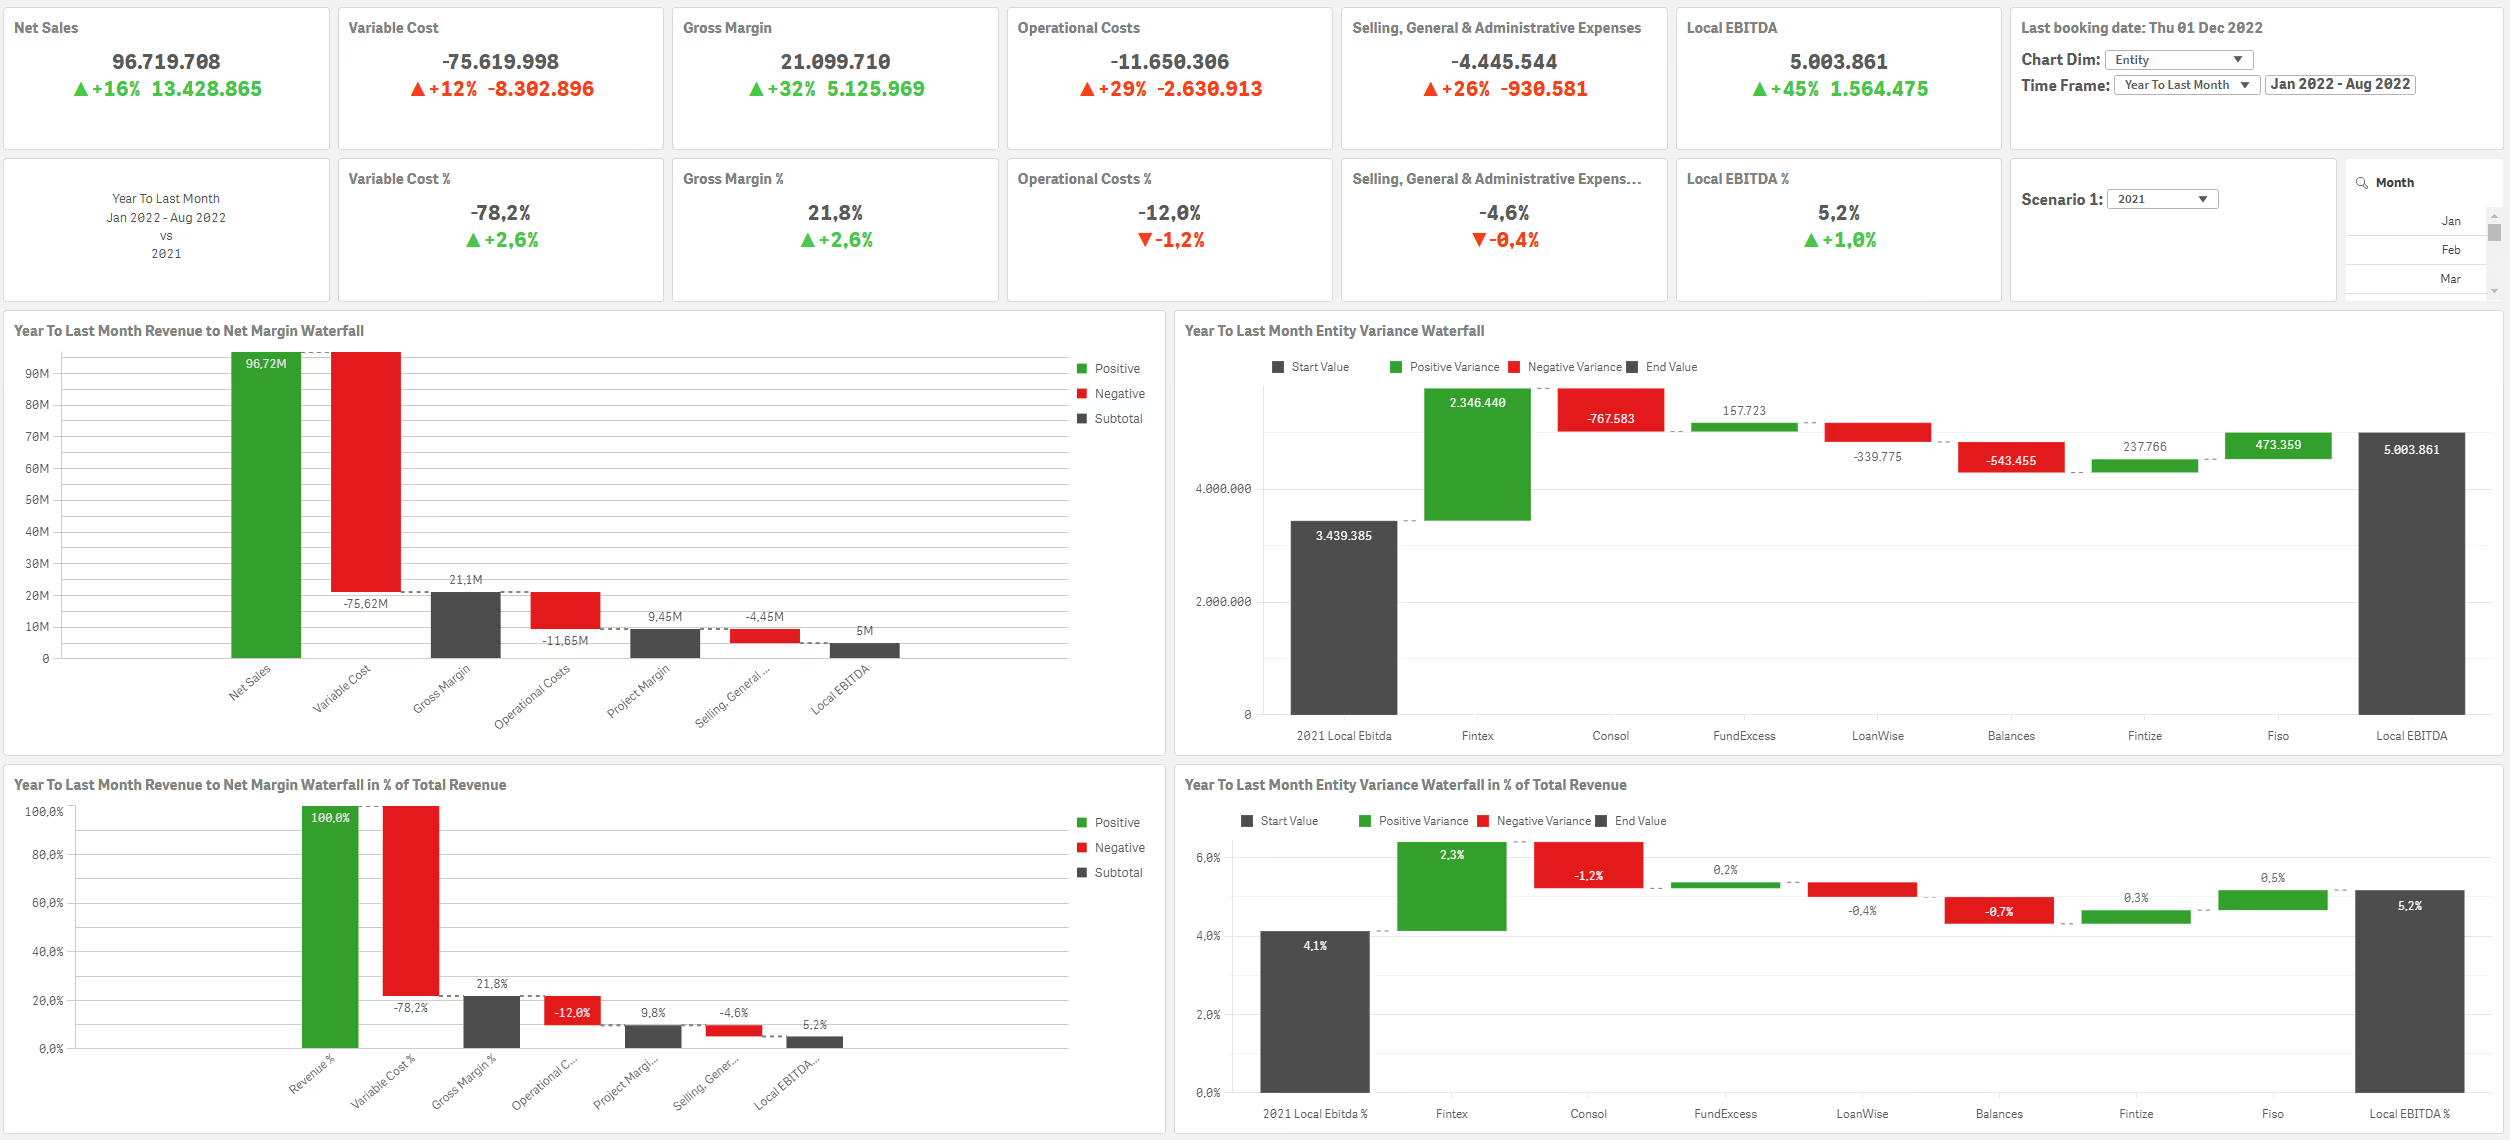
You will have the opportunity to quickly answer all your strategic and operational questions. From profit and loss (P&L) analyses to balance sheets, inter-company eliminations, cash flow and accounts receivable management — the Finance App offers a comprehensive solution for managing your financial data across one or more entities.
Financial stability starts with clear insights. The InsightData Finance App is a powerful tool for analyzing your financial performance and managing risks. Whether it's cash flow management, cost control or profitability analysis, we give you the security to make better-informed decisions and monitor your financial stance.
Thanks to our new data visualization and data analysis application, we save a lot of time in the sales and marketing department. We also optimized our prices and margins, increasing our turnover.

Not only did we accelerate the consolidation of all our companies enormously, but we also significantly improved the quality of our financial reports. We now have real-time insight, allowing us to make adjustments faster and more accurately.

It has taken our business operations to a higher level. For the first time, we have real-time insights that enable us to respond quickly and accurately to changes within our organization.

The Finance App provides executives, finance teams, and management with insights into financial performance, cash flow, balance sheet, P&L, budgets, forecasts, and outstanding items. The App helps to make financial reporting faster, more consistent, and less reliant on Excel. This way, you gain insight not only into the numbers themselves but also into the causes behind deviations in revenue, costs, margin, cash flow, or results.
The Finance App is designed for SMEs and growing companies that want to professionalize their financial reporting. The App is particularly relevant for companies with multiple legal entities, departments, cost centers, locations, projects, or business units. Companies that currently spend a lot of time on monthly reporting, consolidation, or Excel reports will also gain significant value from the Finance App.
You gain insight into P&L, balance sheet, cash flow, accounts receivable, accounts payable, budget versus actuals, forecasts, consolidation, cost structure, and financial trends over time. Depending on the available data, you can analyze by company, department, cost center, project, customer, product group, region, or period.
Yes. The Finance App can make P&L reporting faster and clearer. You can interactively track results by month, quarter, year, entity, department, cost center, or other dimensions. This allows you to quickly see where revenue, costs, or margin deviate from budget, forecast, or the previous year. This not only makes financial reporting faster but also much more useful for management decisions.
Yes. Cash flow and cash forecasting are the most important insights in financial reporting. The App can help you better monitor incoming and outgoing cash flows, outstanding customer and supplier invoices, payment behavior, and your expected cash position. This provides quicker insight into liquidity and allows you to better anticipate future cash needs.
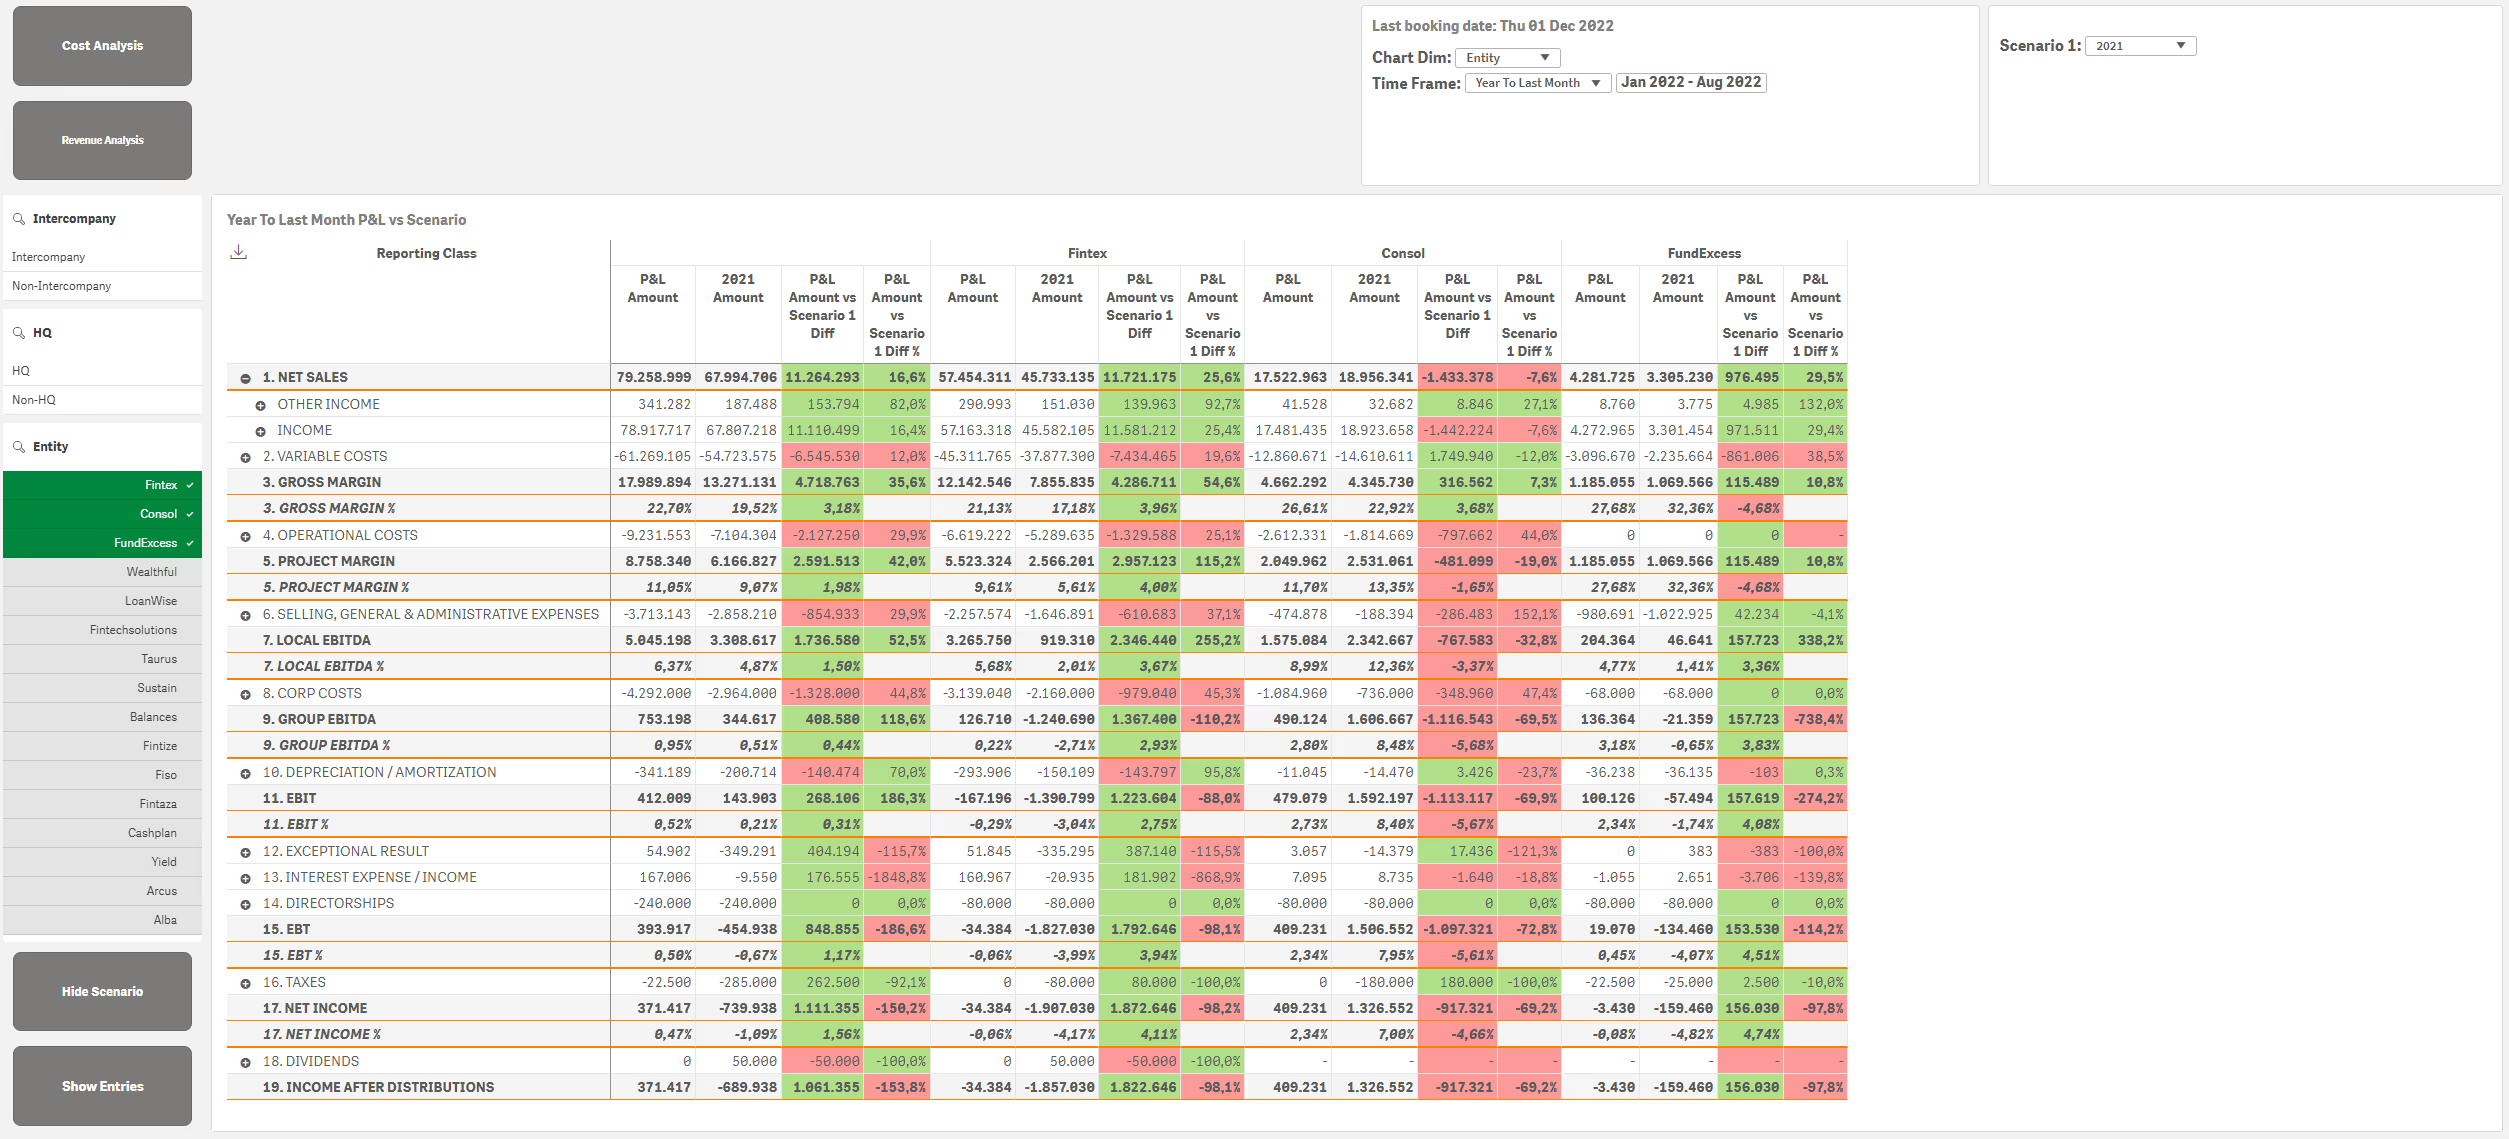
Yes. For multi-entity businesses, the Finance App can help bring together financial data and report on it in a consolidated manner. This includes group reporting, inter-entity comparisons, intercompany eliminations, and consolidated results. This is particularly valuable when consolidation currently requires significant manual effort in Excel.
Yes. The Finance App can compare budgets (with multiple scenarios), forecasts, and actual figures. This allows you to see where revenue, costs, margin, or results deviate from the plan. Budgets can originate from financial systems or from structured Excel files when budget information is not yet available in ERP or accounting.
Yes. The App provides insight into outstanding receivables, outstanding payables, overdue invoices, payment terms, and working capital trends. This helps finance teams to quickly identify where payment risks arise, which customers consistently pay late, and which amounts will impact cash flow in the short term.
Examples include revenue, gross margin, EBITDA, net profit, cash flow, working capital, outstanding receivables, outstanding payables, DSO, DPO, budget variance, costs per department, results per entity, and consolidated results. Also, KPIs such as recurring revenue, cost ratios, margin per business unit, or financial performance per project can be relevant depending on the available data.
Yes. That is often very valuable. By combining financial data with sales, projects, transport, production, supply chain, or HR, you gain a clearer understanding of why financial figures evolve. For example, you can link margin per customer to sales data, project results to hours and costs, or personnel costs to departments and operational performance.
Typical data sources include accounting software, ERP, Excel budgets, CRM, project software, invoicing data, and financial databases. The exact data sources depend on how your financial processes are currently structured and which reporting you want to automate.
You can make better decisions about where costs need to be adjusted, which entities or departments are performing well, where cash flow is under pressure, which budgets are deviating, and which financial risks require additional follow-up. The App helps finance and management move faster from reporting to action.