Efficient operations are the key to success. You get full control over your operational processes. Uncover bottlenecks, monitor performance, and improve productivity. Our tools help you make smarter choices and continuously optimize your business operations.
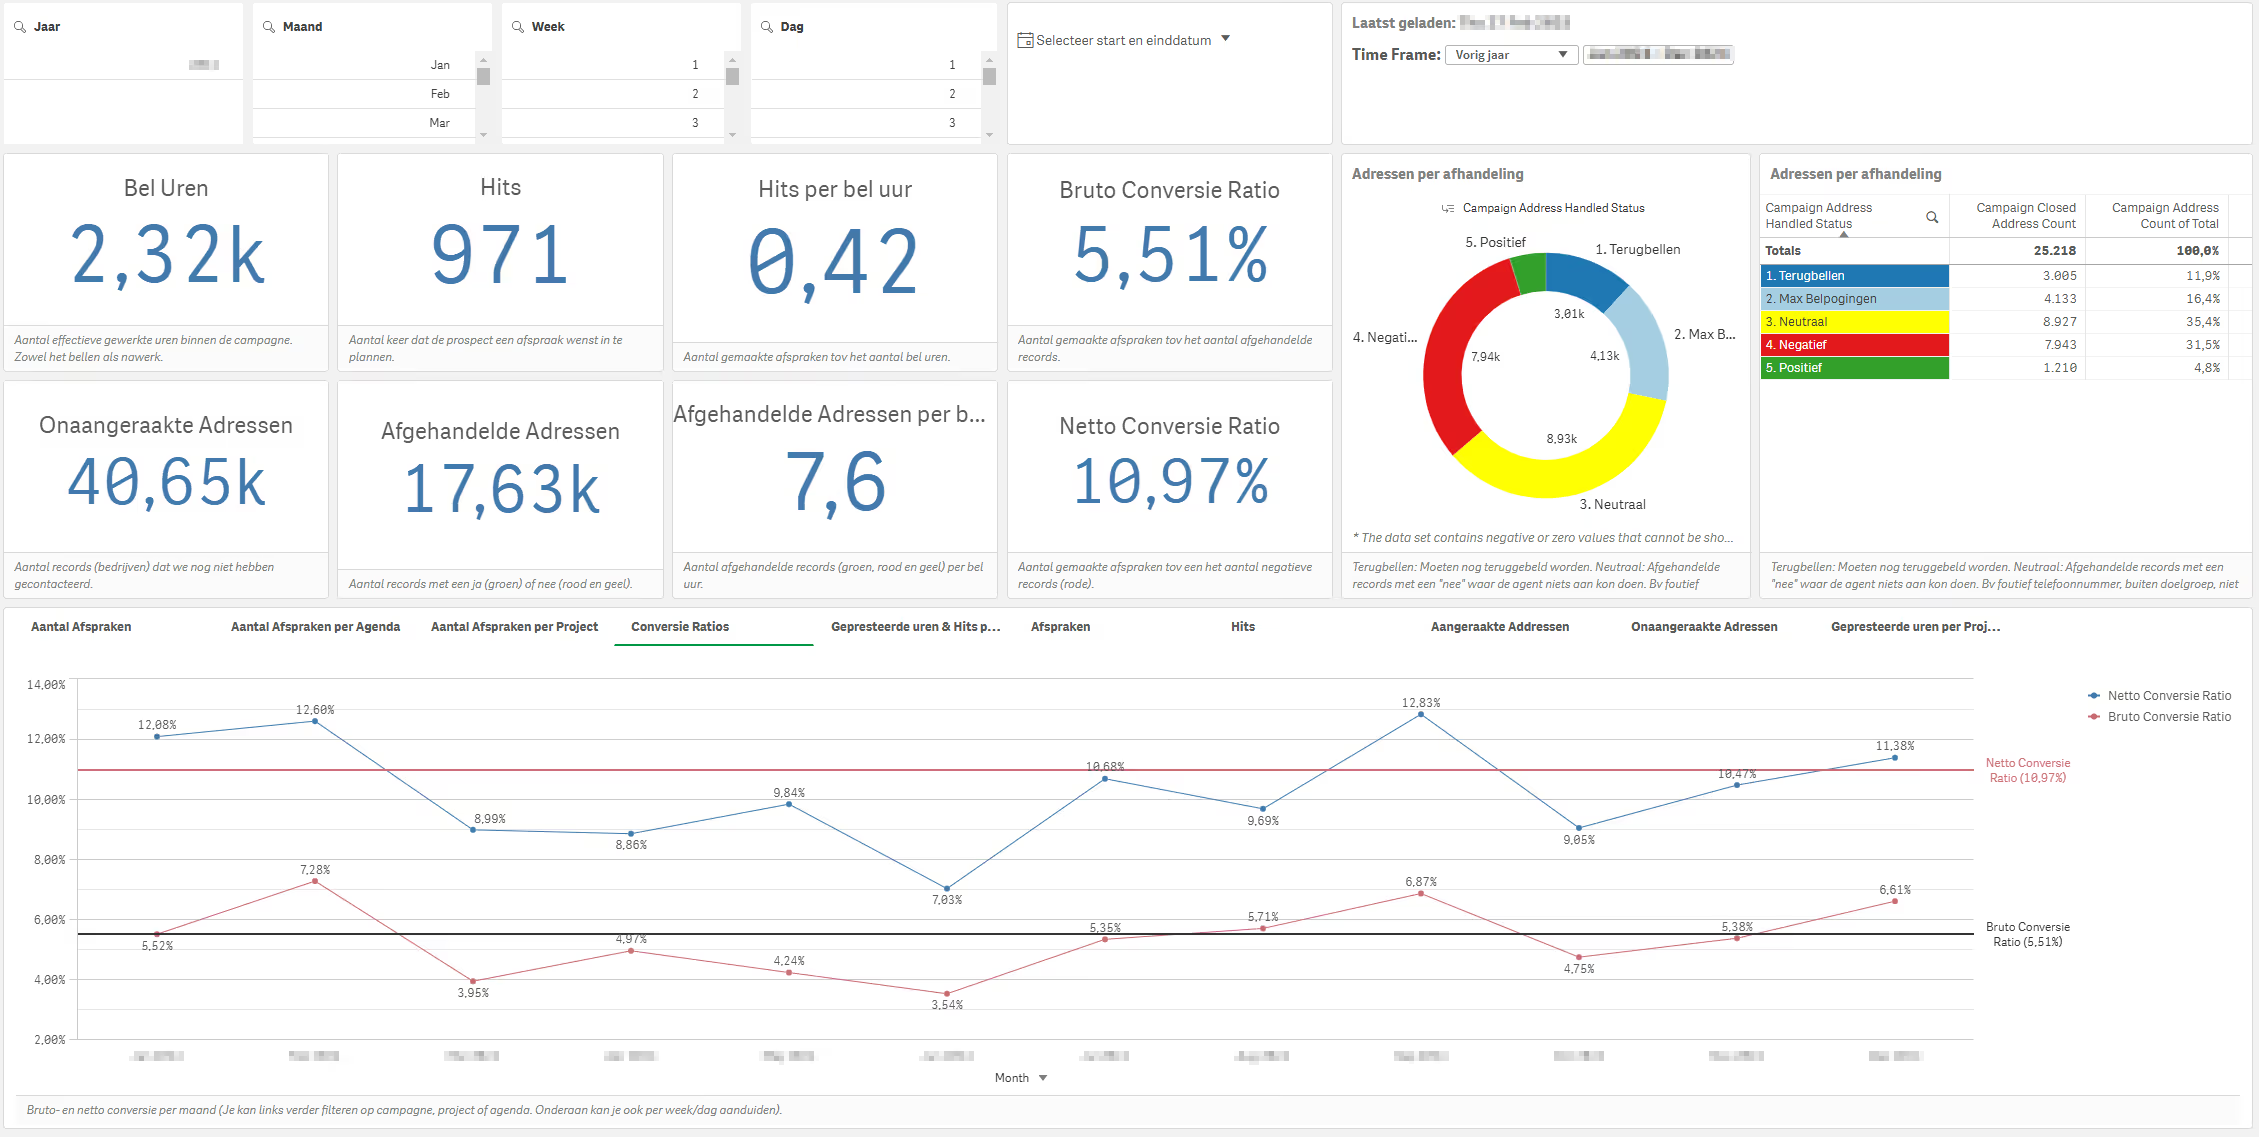
InsightData Apps provide an overview of important statistics and facilitate insight into profitability. This leads to more efficient business operations at lower costs, while customers can monitor their data live.

Thanks to InsightData's business intelligence apps, we save 1 FTE, which we now use more meaningfully. We also got new insights and optimized our marketing budget by establishing a clearer link between campaigns and sales.

Thanks to automation and clear dashboards, we can now focus on analyzing results instead of wasting time collecting data.

The Operations App brings operational data together in clear dashboards. The App helps better monitor processes, orders, planning, capacity, execution, costs and performance. The exact setup depends on how your company operates. For some organizations, the focus is on order processing and delivery reliability. For others, the focus is on capacity, efficiency, planning or operational margin.
The Operations App is suitable for companies where operational execution has a major impact on margin, customer satisfaction and efficiency. Think of wholesalers, logistics companies, production companies, service providers, installation companies, distribution companies and organizations with many orders, processes, locations or operational teams.
You get insight into operational performance such as order volume, lead times, delivery reliability, open orders, capacity, workload, costs, productivity, bottlenecks and deviations. Depending on the data, you can analyze by department, branch, customer, product group, order type, team, region or process step.
Yes. By bringing operational data together, you can see faster where processes slow down or where work accumulates. This may involve orders that remain stuck, delayed deliveries, capacity under pressure, overloaded teams or process steps where errors or delays occur structurally.
Yes. This is often one of the biggest advantages. By combining sales data with operational data, you see not only what was sold, but also how well it was executed operationally. For example, you can analyze which customers generate a lot of revenue but also create a lot of operational complexity. Or which product groups sell well but put significant pressure on planning or execution.
Examples include order volume, open orders, lead time, delivery reliability, service level, productivity, capacity, workload, error rate, cost per order, team performance and operational margin. KPIs such as backorders, waiting times, planning rate or SLA performance may also be relevant, depending on your processes.
Yes. The App can help make capacity and workload more visible. You see where pressure arises, which teams or departments are heavily loaded and where planning may need to be adjusted. This supports better decisions on staffing, priorities, planning and operational feasibility.
Typical data sources include ERP, planning systems, WMS, TMS, CRM, time registration, operational software, Excel files and databases. The right data sources depend on your operational processes and on the questions you want to answer.
Yes. By linking costs to orders, customers, processes, teams or activities, you get a better view of operational profitability. This helps show where costs arise, which processes are inefficient and which customers or activities require more operational effort than expected.
You can make better decisions about where capacity is needed, which processes should be improved, which customers or activities weigh heavily operationally and where costs or delays arise. The App helps manage operations based not only on feeling, but on figures.