Why KPIs are crucial in logistics
In the logistics sector, efficiency is everything. Delivery reliability, lead times and return rates have a direct impact on customer satisfaction and cost structure. KPIs form the bridge between operational activity and strategic direction. They make performance measurable, detect bottlenecks and drive continuous improvement. Whether you work with your own fleet or outsource logistics: clear KPIs are essential.
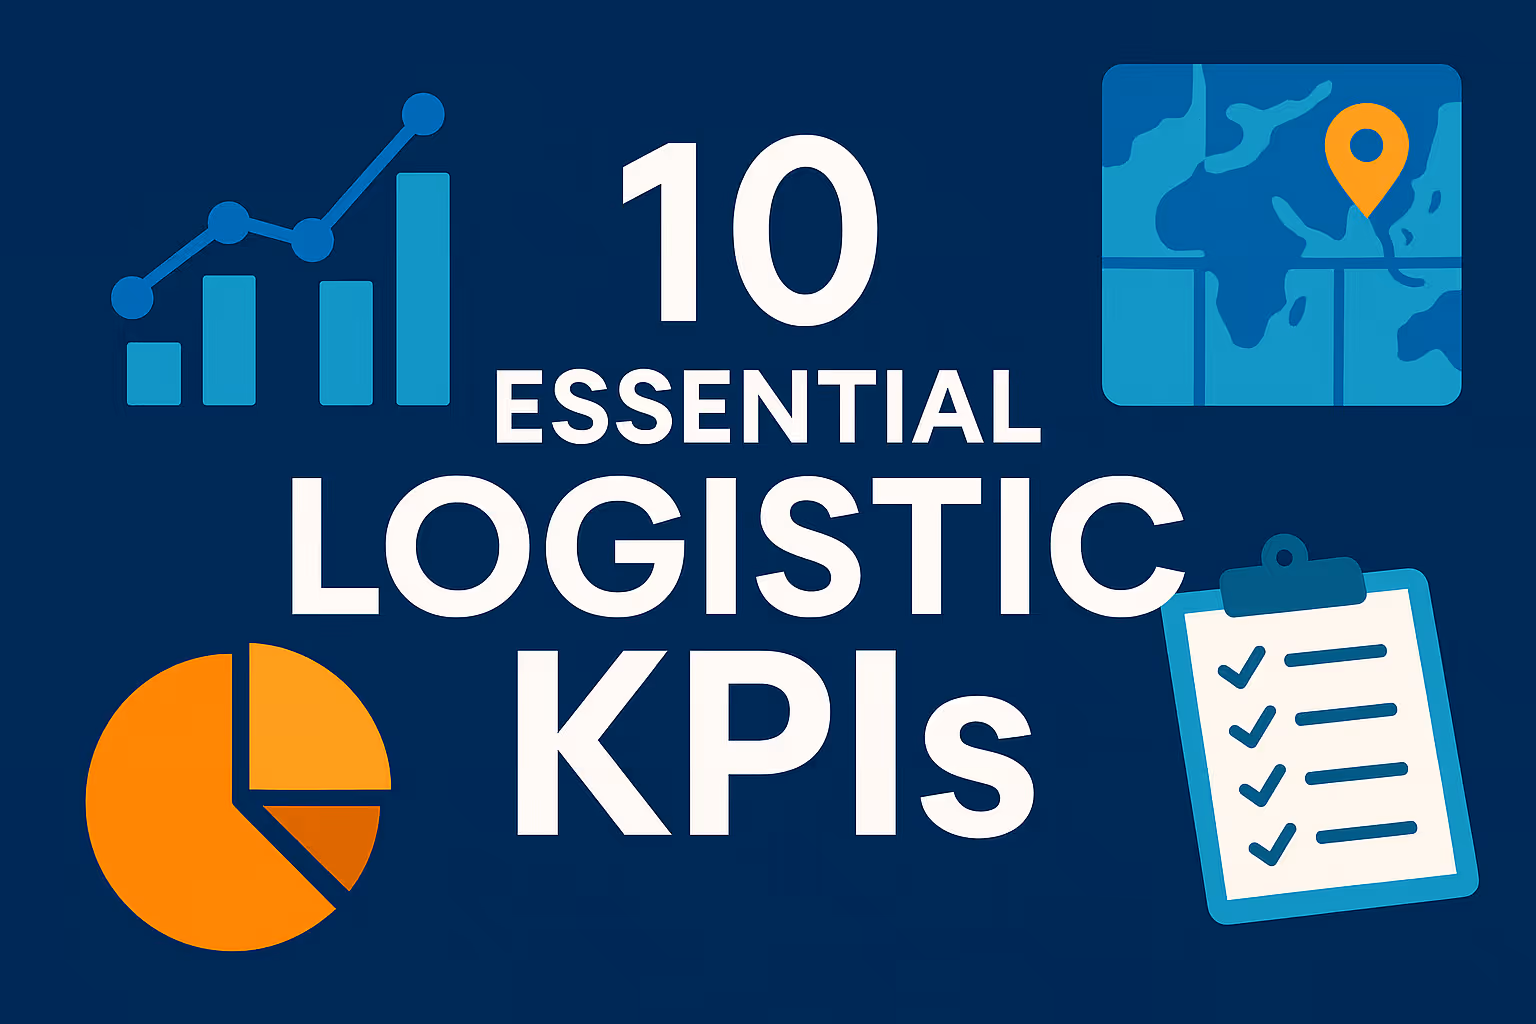
Top 10 logistics KPIs and what they measure
Below are ten commonly used KPIs that provide a good picture of your logistical performance. For each KPI, we provide the meaning, formula and application:
- On Time Delivery (OTD): Percentage of shipments delivered at or before the agreed time.
Formula: Number of deliveries on time/total number of deliveries x 100
Application: Essential for customer satisfaction and SLAs. - Average waiting time per shipment: Length of time between arrival on site and actual processing or departure.
Formula: Total waiting time/number of shipments
Application: Provides insight into process delays at loading docks or depots. - Order pick accuracy: Number of error-free deliveries compared to total orders.
Formula: Number of correct picks/total picks x 100
Application: Quality indicator for warehouse management. - Warehouse lead time: The average amount of time that goods stay in storage.
Formula: Average time between inbound and outbound
Application: Optimization of inventory management and space utilization. - Load capacity per trip: Efficient use of means of transport.
Formula: Average filling in m³ or kg/vehicle capacity
Application: Increases transport profitability. - Return rate: Share of deliveries that come back.
Formula: Number of returns/total number of deliveries x 100
Application: Product quality and order processing indicator. - Claim fee per delivery: Average cost of claims or loss per shipment.
Formula: Total claim costs/number of deliveries
Application: Financial measure of reliability. - Inventory rotation: How many times you sell your entire inventory in a given period.
Formula: Sales Value/Average Inventory Value
Application: Measure inventory refresh and capital efficiency. - CO₂ emissions per shipment: Environmental impact of your logistics operations.
Formula: Total CO₂ emissions/number of shipments
Application: Monitor sustainability goals. - Dock to Stock time: Time between goods receipt and effective entry into the system.
Formula: Average time in minutes or hours
Application: Speed of your inbound process.
Data sources and measurement methods
Use your TMS (Transport Management System), WMS (Warehouse Management System), or ERP as primary sources. Provide uniform definitions per KPI, coordinated with all teams involved (transport, warehouse, customer service). An order that is “on time” according to dispatch, but “too late” according to the customer, indicates a definition shell. Document formulas centrally and work with a KPI handbook. See also the complete KPI dashboards guide.
How do you formulate KPIs correctly?
Each KPI must be linked to:
- A clear definition
- A source (e.g. structured database or export from TMS)
- A calculation frequency (daily, weekly, monthly)
- A person in charge (e.g. warehouse manager, planner) Ensure consistent use of time units and filters. Optionally combine with the SMART method
Visualization: what works in a logistics dashboard?
A good logistics dashboard is more than just an overview of numbers. Think visually and thematically:
- Geographic distribution maps (deliveries by region)
- Order flow funnels (ordered > picked > delivered)
- Line graphs for developments (e.g. waiting time per week)
- Thermometers for standard KPIs (such as return rate)
- Alerts (e.g. OTD < 90%) with color display. Limit the number of KPIs per screen to five. Offer filters for customer, period, shipment type, or warehouse.
Putting KPIs into context: benchmark and trend
A KPI without context means little. Is a 6% return rate good or bad? That depends on the sector, product type and customer expectations. So use:
- Sector benchmarks or internal standards
- Comparison with last year or last month
- Targets (e.g. OTD ≥ 95%)
- Seasonal effects Combine numbers with explanations or notes from those responsible.
Team-based work with KPIs
KPIs are not an end in themselves, but a means of improving collaboration. Link each KPI to a person responsible and give them access to the relevant dashboard. Organize monthly KPI meetings in which teams discuss deviations, name causes and formulate improvement actions. Also use KPIs with team targets and bonuses.
Common mistakes in logistics KPIs
- KPIs without explanation or interpretation
- Too many numbers with no priorities
- No action plan in case of deviation
- Manual reporting without automation
- Different definitions across departments
Finally: KPIs as a lever for logistical growth
Strong KPIs ensure focus, efficiency and transparency. They not only help you monitor current performance, but also guide future optimizations. Combine technical tools (Power BI, TMS) with organizational support and structural follow-up for maximum effect.
Want to delve further?
- Discover the InsightData Supply Chain App for all your logistical KPI challenges.
- How to build a visually strong dashboard
- KPI definition methodology
- Everything about governance and reporting
- Explore the InsightData Supply Chain and Operations Apps