Today, a well-structured KPI dashboard is essential for turning data into strategic action. Companies that clearly visualize their performance indicators make decisions faster and continuously improve their processes. In this guide, you'll discover how to set up an effective KPI dashboard, from KPI definition to implementation, including concrete tips, practical examples and tools.
What is a KPI dashboard?
A KPI dashboard collects and visualizes key figures related to your organization's goals. Think of gross margin, customer satisfaction or delivery reliability. It helps to monitor performance objectively and make faster adjustments. Unlike a traditional report, a dashboard offers real-time insight and is interactively structured. The visual nature also makes it suitable for processing information faster and recognizing trends.
Without a KPI dashboard, you run the risk of making decisions based on gut feeling, outdated reports, or fragmented data. Especially in dynamic markets, this is a risk that your company cannot afford. A good dashboard, on the other hand, offers guidance: it makes performance measurable, negotiable and controllable.
What are good KPIs?
Good KPIs are SMART: specific, measurable, acceptable, realistic and time-bound. The SMART method ensures that goals become concrete and testable. Let's say your goal is to increase customer satisfaction: instead of vague “happy customers”, formulate “increase customer satisfaction score from 78 to 85 by Q4 2025". SMART KPIs provide focus and clarity.
The power of a dashboard depends on reliable data sources and clear visualizations. Connect your ERP, CRM or accounting package to avoid manual errors. A dashboard is only as accurate as the underlying data. That's why data quality is a critical success factor.
Provide automatic data updates with logging. Make sure definitions are consistent (what counts as a quote, when does delivery start, what is net margin?) and coordinate them with stakeholders. Define who is responsible for updates, checks, and exceptions by data source.
How do I visualize data?
A good KPI dashboard isn't just a series of graphs. It tells a story. Use a limited color palette, put the most important KPI at the top left, and add sparklines to show trends. Provide context: what is the goal, how far are we, what is the evolution?
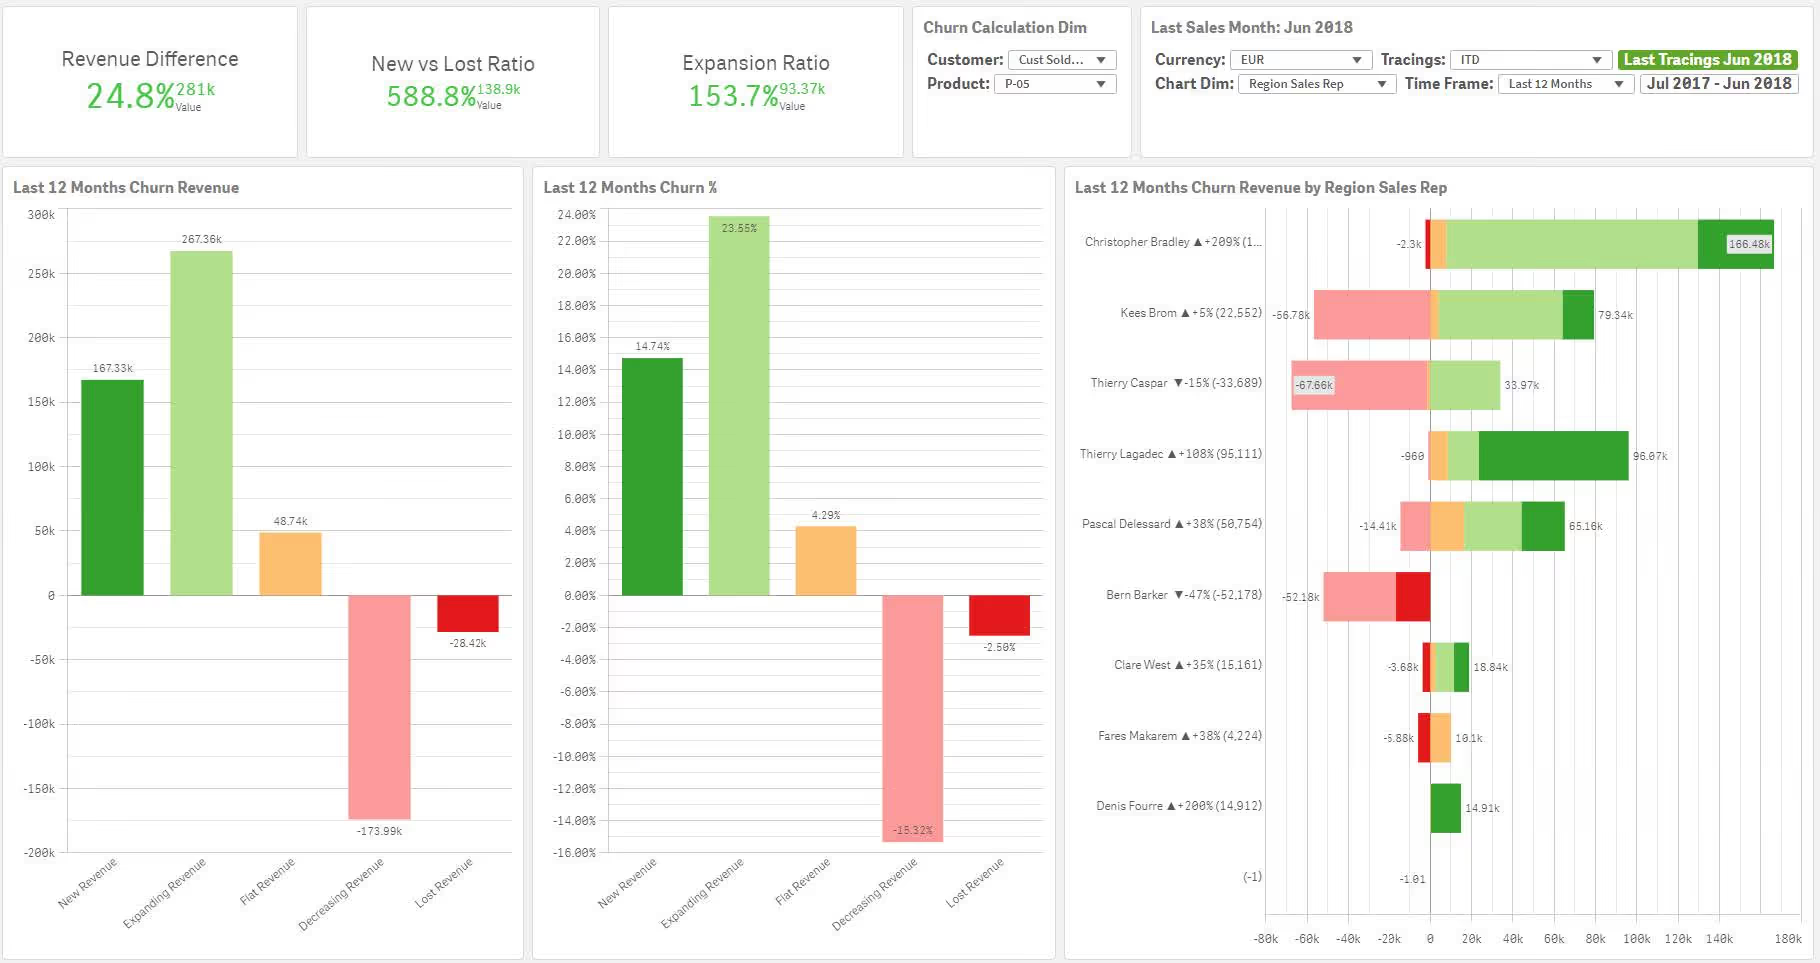
Use visualizations that match the type of data:
- Bar charts for comparisons between departments or time periods.
- Line graphs for trends over time.
- Gauge or thermometer for performance versus target
- Process analysis funnels (e.g. quote > order > delivery).
What is data governance?
Make sure each KPI has an owner. It monitors quality, interpretation and updating. Schedule a monthly data validation and a quarterly review to maintain relevance. Governance is crucial for keeping dashboards reliable and actionable.
Which BI tools are available?
With Power BI or Qlik Sense, you can build intuitive dashboards based on live data. Use standard connectors for Excel, SQL, or cloud applications such as Exact Online or Salesforce. Build a data model with facts and dimensions tables. Make sure you have the correct calculations (e.g. turnover compared to last year, gross margin per product line).
Choose visuals that communicate in a targeted way: column graphs for purpose vs. achievement, gauges for performance, and slicers to select periods or departments. Build thematic dashboards by team or domain, and provide role-based access (Row Level Security).
Implementation step-by-step plan:
1. Inventory objectives
2. Selecting KPIs
3. Aligning sources and definitions
4. Set up a data model
5. First visualizations, prototypes
6. Collecting User Feedback
7. Define governance
8. Planning a go-live and follow-up
Pitfalls in a BI project
Common and avoidable mistakes:
- Show too many KPIs
- Just measuring outputs
- Ownerless KPIs
- Inconsistent definitions
- Show no context
Start your own BI project with an advantage
InsightData offers standard KPI dashboards for